SPICE 101
Happy New Year!
Today we will have a closer look at SPICE and SpicePy. The goal is you can draw some orbits yourself, no need to wait for me :)
SpicePy is Python wrapper for the NASA toolkit, so I assume you do have basic Python skills. No worries though - I’m not Python guru myself, I’ve spent most of my career close to Java.
Why not Java in such case? Especially that SPICE provides official Java bindings? I need to give justice to Python ecosystem - adhoc data analysis and visualization is so, so much simpler here. You will see soon.
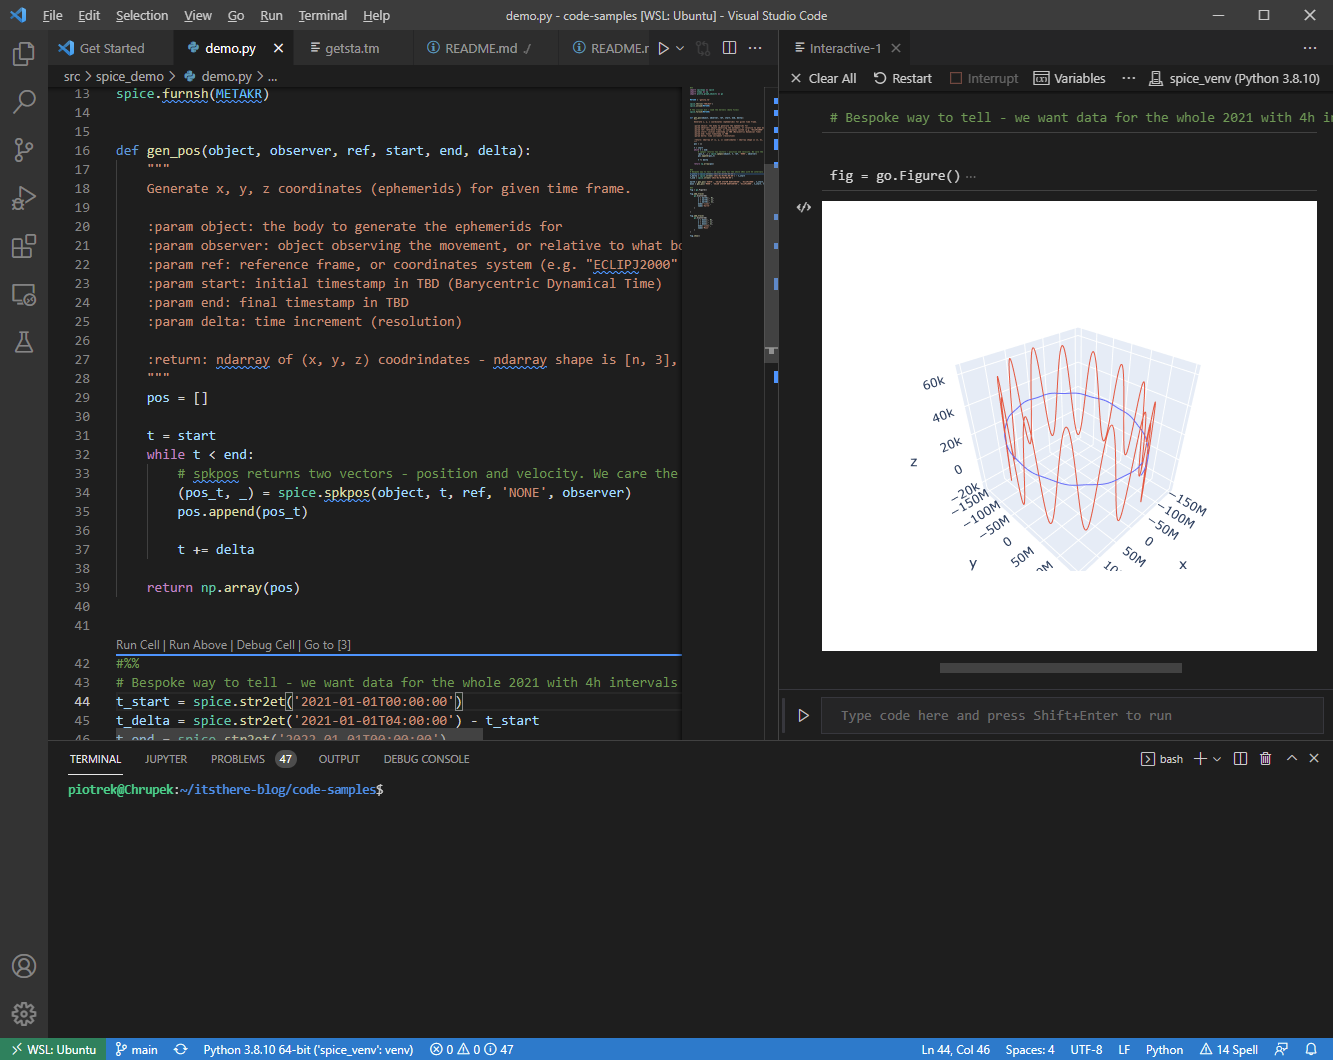
For the coding environment - I’m using Python 3.8+ on Linux (Ubuntu) and Visual Studio Code + Python Plugin + Jupyter Plugin. To be really precise, this is Ubuntu on WSL2. This means we have Linux and Windows users covered. For Mac… let me know if the steps work for you too :)
One more thing. I’m not using Jupyter, at least not directly. VSCode has excellent Interactive Mode which IMHO makes Jupyter obsolete. At least when it comes to single box dev and runtime setup. It still uses Jupyter engine under the covers, but you can use VSCode for coding and running the code. This means plain Python files rather than Jupyter notebook file format. Give it a shot - my Python-fluent friends were quite surprised!
Back to business now. Let’s install the required packages first. All is well documented in SpicePy Installation guide, yet we’re adding three more:
- notebook - for interactive mode (will get there)
- plotly - for generating interactive plots (also good for HTML embedding). See the manuals
- pandas - as required by plotly. Get familiar with the lib if you’re not yet - will make you stop using spreadsheets so much.
You will also see I’m creating a virtual environment, so the env is isolated (avoiding conflicting libraries, etc.):
python3 -m venv spice_venv
. ./spice_venv/bin/activate

pip install -U pip setuptools wheel
pip install -U numpy
pip install -U pandas

pip install spiceypy

pip install notebook
pip install plotly
With these installed, we’re almost good to start coding. We still need two files from NASA, so called “kernels”:
- leap seconds kernel, so TBD (Barycentric Dynamical Time) can be calculated. This is “naif0012.tls” and you can grab it from here
- actual coordinates or ephemerids. For Earth and the Moon we’re good with “de430.bsp” with can be found here
Create “data” directory and place the files there. Now we’re good to code.
First we need a config file to tell SPICE which kernels to load. The file is usually named “getsta.tm” and in our case looks like this:
KPL/MK

   \begindata
   KERNELS_TO_LOAD = ( './data/de430.bsp',
                       './data/naif0012.tls')
   \begintext
Now the actual code. Initialize SPICE frst:
METAKR = 'getsta.tm'

print(spice.tkvrsn('TOOLKIT')) # Print version to confirm libs loaded OK
spice.unload(METAKR)
spice.furnsh(METAKR)
With this done, we can start generating the X, Y, Z for the two celestial bodies. The function you want to call is:
spice.spkpos(object, time, reference_frame, aberration_correction, observer)
The meaning of the parameters is:
- object - which celestial body we want the ephemerids generated for. “EARTH” or “MOON” in our case.
- time - timestamp in TDB (Barycentric Dynamical Time) because any earth-based clock (UTC included) in space is like a vacuum. It sucks :) Read SPICE tutorials, as I told you earlier!
- reference_frame - which way is “up/down”, “left/right”, etc. For our case (plotting Earth and Moon orbits around the Sun) the ecliptic is the most convenient, so we put “ECLIPJ2000” here.
- aberration_correction - let’s leave it as “NONE” for now. Quite important though if you want to time a picture for a distant body.
- observer - relative to which body the (x, y, z) should be generated. You planned putting “SUN” here? Almost. We will use “SOLAR SYSTEM BARYCENTER”.
All clear, but how to get the TBD time? There is a really handy function to parse what we earthlings understand better:
t = spice.str2et('2021-01-01T00:00:00')
And that’s it! We’re good to generate ephemerids for any period of time and plot. Here is how it looks like for 2021 (it’s interactive, so you can zoom, spin, slide. Thank you, Plotly!)
For full source code see demo.py in this location.
If all goes well, your VSCode should look something like this:

Next time I’m going to share how do I host this blog. Oh, there are lessons learned…
Have a good night! Don’t look up Look up ;)
