Be careful what you wish for
Indeed, you may find more than you ever wished for. All I wanted was a database. Now my laptop could guide spacecrafts through the Solar System - I’ve got both the database and the software.
Say hallo to SPICE!
I do admit, the page looks humble - I was worried if it’s dead. But when I started digging around, I understood this is a true gem. Sweet mother of everything that’s fluffy! This must be the internet’s educational aspect I’ve heard so much about!
Ok - go to Tutorials and check the first couple of them. The “04. Concepts” should be a text book and open any physics class on space. You will never trust UTC again (at least for talking about the future) or at least you will think twice before saying “at Dec 1st, 2050” vs “in XYZ seconds”. Ask your computer science, data center or power grid friends for leap second scary stories ;)
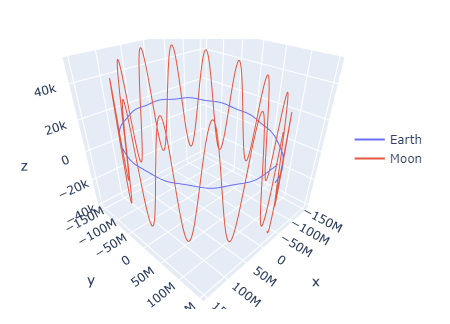
But how can we see some data? Luckily, SPICE toolkit isn’t that difficult to use + there’s SpicePy Python wrapper. Really handy for ad-hoc exploration. Let’s plot the Earth and Moon in 2020 (in Ecliptic J2000 reference frame):

Wait. What? No, all good. Look again - the “Z” axis is in thousands of kilometers, where X and Y are in millions! This makes the orbits almost overlay in X/Y - the mean distance Earth-Moon distance is ~385 thousands of kilometers, where Earth-Sun is 150 million. Visually exaggerated is the Moon going “up” and “down”. Remember the Moon orbits the Earth with 5.15 Deg inclination. Check Wikipedia for really good graphics on what’s going on - Orbit of the Moon.
Fine for the Moon, but the Earth orbit looks wobbly too. Let’s zoom in:

Did you read the “Concepts” tutorial? Did you notice the term “barycenter” all over the place? Did you check Wikipedia on Moon’s orbit? Let me quickly quote the last one:
Earth and the Moon orbit about their barycentre (common center of mass), which lies about 4,670 km (2,900 mi) from Earth’s center (about 73% of its radius), forming a satellite system called the Earth–Moon system.
So it’s not only the Moon that’s orbiting. The Earth is doing it the same! When the Moon goes “up”, the Earth goes “down”. Love the fact even the astral bodies need to follow the rules ;)
I’ve spent long hours playing with SPICE and plotting different graphs, checking numbers, velocities… The school picture of majestic Sun standing still in the center and planets making perfect circles (or ellipses) is gone forever. Not because I wasn’t aware this picture wasn’t true, but finally I have had the opportunity to see it. Everything is so flexible, wobbly, almost hypnotizing. I believe there are kernels (data files) showing space probes paths into space too. Just amazing.
Notes to myself:
- Learn how to embed Plotly into GitHub Pages - so you can zoom and rotate the graphs by yourself
- Clean up my Python notebook and share how to use SpicePy
It’s getting late. Need to see the Moon before I go to sleep.
